Volatility Is A Drag
I mean that quite literally. Volatility causes a drag effect on investment returns. And although modern portfolio theory teaches that investments with expected higher returns generally have higher volatility, volatility itself always negatively impacts returns. This is not a theory but a mathematical fact that can easily be demonstrated.
Let’s take a hypothetical example. You’ve been watching company A because it’s been a steady, well-managed performer in an industry sector with high barriers to competition. So one day you decide to buy $1000 worth of A’s stock, and at your next monthly investment group meeting, you excitedly announce this new acquisition to your investment portfolio. To your surprise, Sam Smith blithely informs you that he just invested in company B. It’s more volatile but it’s in a dynamic, growth industry, and anyone who doesn’t buy in now is a fool . “Wimps!” declares Jennie Jones in a contemptuous manner. “Company C is so much better. It’s got more momentum than any other company in the market today!” The remainder of the meeting is spent arguing as to who made the smartest choice, with the members ultimately repairing to a nearby bar to add more juice to the discussion.
It’s now one year later, and after having tracked the performance of each stock every day over the past year, you’re ready to share the results with the group. The meeting is packed, and there’s a sense of heightened anticipation as you approach the podium. You begin by announcing to the group that the average return for each of the three stocks over the one year period was exactly the same: 0%. A cry of disbelief is heard from the back of the room. “Impossible!” shouts Sam. “I lost over 26% on my investment. What about you, Jennie?” He turns to Jennie, who looks away silently, head down, gazing at the floor. Finally, in a small voice, she mumbles “I lost over 71%.”
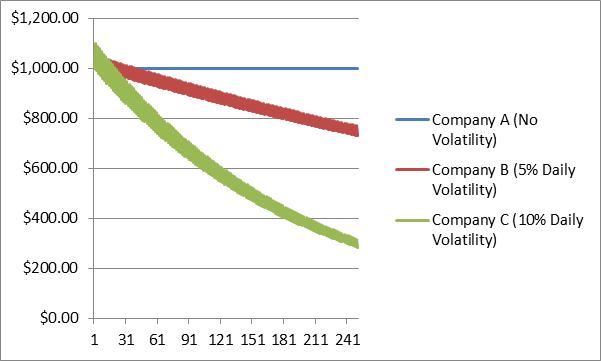
The room explodes in a cacophony of voices. You hold up your hand for silence. “What they said is perfectly true,” you announce to the shocked attendees. “And what I said is perfectly true as well. The difference is the daily volatility that each stock experienced during the year. Sam’s stock surged by 5% the day after he bought it, and then dropped by 5% the following trading day. Its price continued to fluctuate by exactly 5% each trading day, up one day and down the next. As Sam indicated, the result was a 26% price decline over an entire year.” You wait for the noise to subside, and then explain what happened to Jennie. “Company C’s stock fluctuated by 10% every trading day, twice the amount as Sam’s. As a result, its price dropped by over 71% over the year.”
“What about your stock?” someone shouted. You smile benevolently. “My stock did not fluctuate at all. It returned exactly 0% each and every day. As a result, while I didn’t make any money, I didn’t lose any, either.” You return to your seat amidst roaring applause, anticipating a run for the group presidency next term.
The following chart illustrates how the level of daily volatility impacted the returns of the three stocks even though they all returned 0% on average (note that there are about 250 trading days each year).
This effect is simply an outcome of the fact that it requires more than a 10% gain to offset a 10% loss (you actually need more than 11%). It also serves to illustrate the difference between calculating arithmetic returns — which you did in your report to your investment group — versus geometric returns when evaluating investment performance. Geometric returns take compounding into account, especially the negative compounding that occurs when returns are negative. The geometric return for stock B for the year was -26%, exactly the impact that Sam experienced with his stock holding.
Should we try to avoid volatility in our investments? That depends on a number of factors, among them your risk tolerance and your investment goals. There is also no definitive information on whether or not a consistently lower-volatility portfolio can even be created. Those few mutual funds and ETFs that do target lower volatility equities appear to outperform during periods of high volatility and underperform during relatively calm periods. But none have been around long enough to allow us to draw any strong conclusions.
The bottom line is that you should (1) never consider investment performance based on arithmetic averaging, (2) try to control volatility if only to improve your peace of mind, and (3) be careful what you recommend to your investment club.

